
Before you read this article. We have up-to-date Google Analytics content! Check it out here:
- How to Set Up Google Analytics – A Step-By-Step Guide
- How to Setup Filters in Google Analytics
- How to Create Google Analytics Goals
Beginner’s Guide to Google Analytics
Everything from how to setup your account to maximize your results, to what are the most important reports to pay attention to, and a number of advanced tactics as well. If you're interested in Google Analytics you won't want to miss it!
Traffic reports are required reading for any business looking to generate leads or make sales online. A good analytics program can quickly tell you what’s working and what’s not in your Web marketing campaign. Here at flyte we love Google Analytics, a free, powerful reporting tool.
What This Article Is…and Isn’t
This article is about how to read and utilize your Google Analytic (GA) reports.
This isn’t an installation guide, nor do we have the space to delve into every report GA can generate. However, if you’re looking to get comfortable with GA and gain a better understanding of how your prospects and customers are using your website, you’ve come to the right place.
Logging In
Visit http://www.google.com/analytics and login with your username and password. You’ll see a list of any website or blog you’re tracking as Google allows tracking of multiple sites within an account. Click on “View Reports” next to the site you wish to review and you’ll be taken to the Dashboard.
Exploring The Dashboard
Once you log in you’ll see the dashboard, which contains snapshots of several reports generated by GA. (All images can be enlarged by clicking on them.)
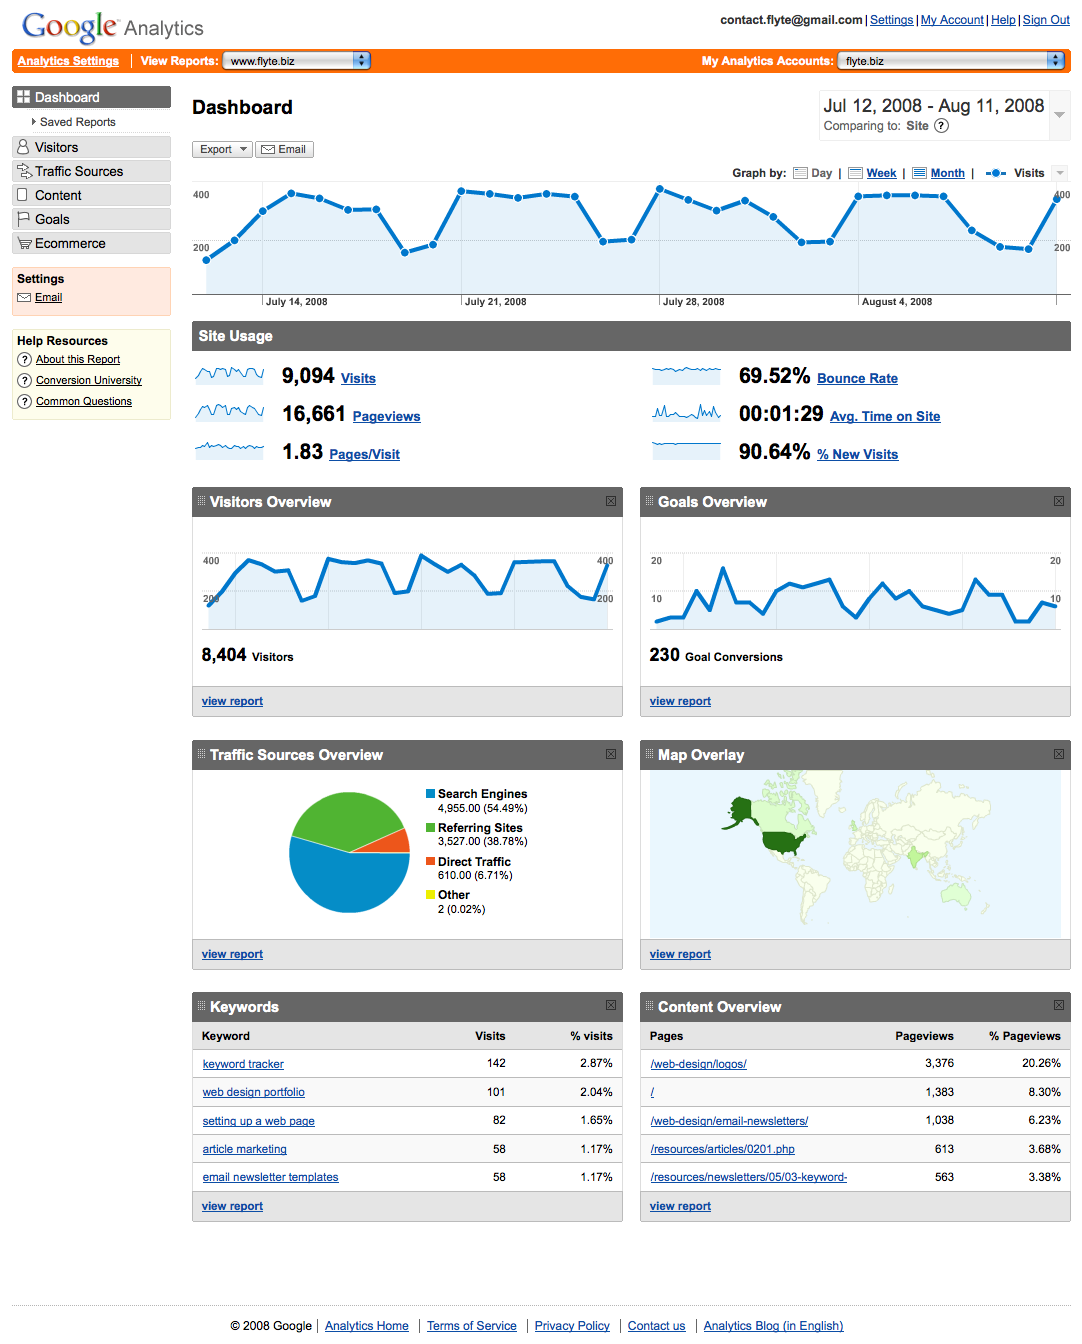
These reports may include visitors, traffic sources, map overlay and content. You can move them around, add new reports to the dashboard, or remove ones you don’t like with drag and drop simplicity.
Near the top you’ll see a section called Site Usage. It includes the following metrics:
- Visits: The number of visits to your site during a given time period.
- Pageviews: The number of pages these visitors viewed.
- Pages/Visit: The average visit in terms of page views.
- Bounce Rate: The percentage of people who only visited one page on your site before they “bounced” somewhere else. (This can often seem deceptively high, but many people will get to your site and realize that it wasn’t what they were looking for, or you may have a popular image indexed by Google’s Image Search that generates a lot of “drive-by” traffic and skews your numbers. Alternatively, it may represent that your site is difficult to navigate or understand for new visitors.)
- Avg. Time on Site: The average amount of time a visitor spends at your site.
- % of New Visits: The percentage of new visitors to your site as compared to all visitors. Some businesses might want lots of new traffic, while others might want generate repeat visits, driving down this percentage.
By default, Google shows you the last 30 days of activity. However, you can change this setting, or even compare two different date ranges, for example August 2008 versus August 2007.
You can achieve this by clicking on the date range box found in the upper right corner and changing the “Comparison” dropdown from “Site” to “Date Range” and entering the appropriate dates. To go back to a singular date range just reverse the process.
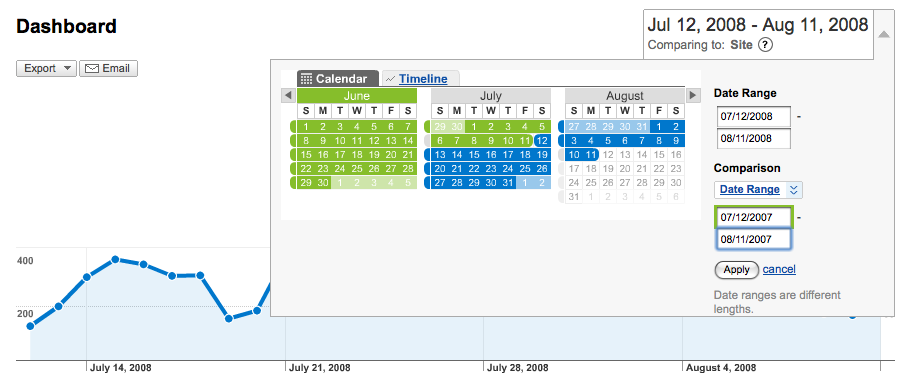
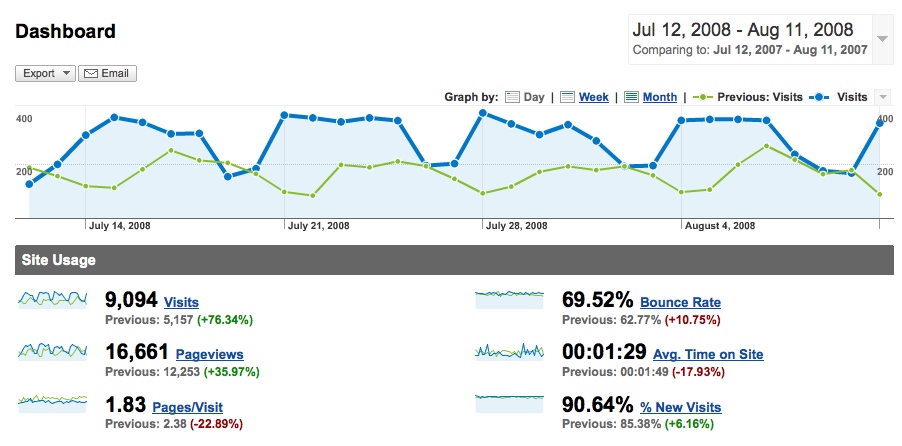
GA will overlay the reports for your viewing pleasure. This helps you get a quick comparison of whether your traffic is trending up or down.
My Five Favorite Reports …these are a few of my favorite things…
There are dozens of reports and hundreds of ways to slice and dice them, but these are the five I recommend you review regularly. They can be found by navigation the left hand menu. Please note that you can also use the date comparison on any of these reports as well.
In addition, on every page there’s an About this Report link in the left hand column that will give specific information about the report you're viewing.
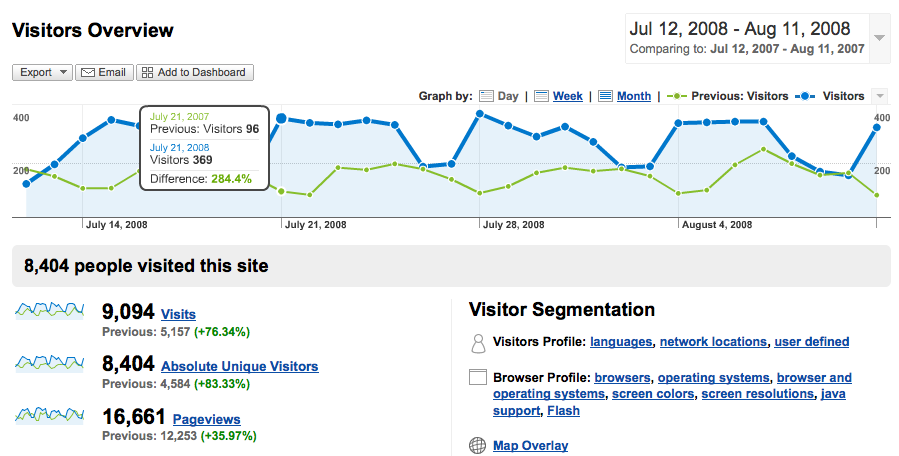
Visitors Overview – This is an essential report that tells you straight up how much traffic you have, how many page views, the average length of visit and your bounce rate. You can delve deeper depending on your needs, finding out how much new traffic you’re getting, what size monitors your visitors have, whether they use broadband or dial-up, and much more.
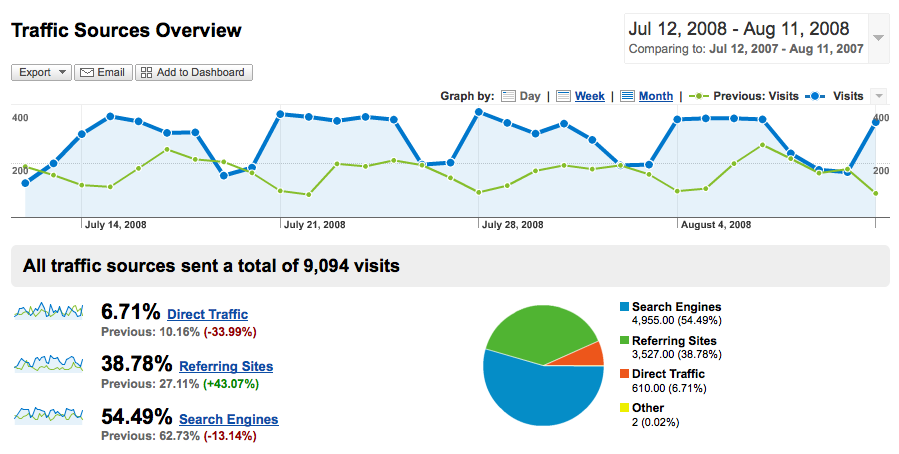
Traffic Sources Overview – Where did your visitors come from? Search engines, other websites or did they type your URL into their address bar? This report breaks it down and tells you your best traffic sources. It may also show you where you need to put more energy into developing more traffic.
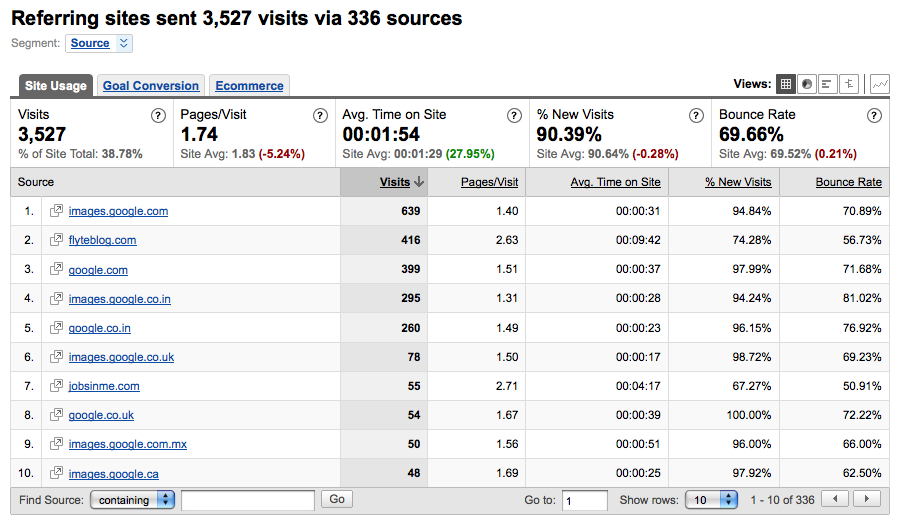
Referring Sites (under Traffic Sources) – These are the sites visitors were at before they arrived at your site, not including search engines. (Although images.google.com is listed as a referring site and I consider that to be a search site, but I digress.)
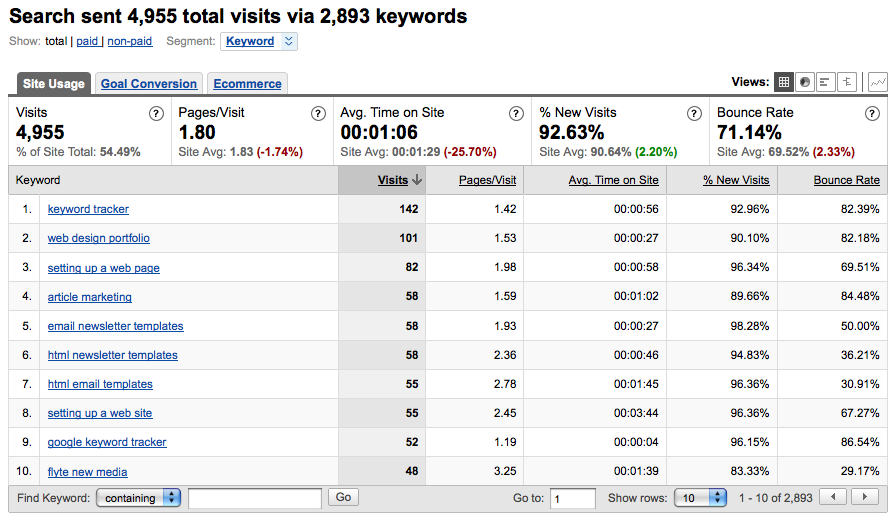
Keywords – What words did visitors use at Google and the other search engines to find your site? This report will tell you, and give you detailed info on how valuable each keyword is in terms of how long visitors spend at your site, how many pages they view, and even whether they “convert” by filling out a contact form, signing up for an email newsletter or buying something from your store.
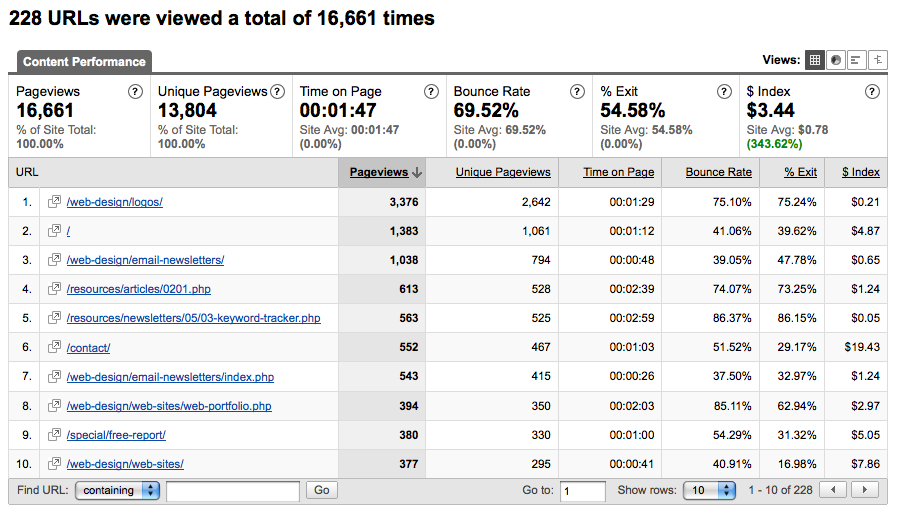
Top Content – What pages get the most traffic on your site? This report breaks it down for you so you can better see how people are using your site.
As I mentioned, there are plenty of other reports—some which will be more appropriate for your specific business, especially if you offer e-commerce.
Two Bonus Faves
Two other reports that I like give you information on where people are coming from, and where they’re going to.
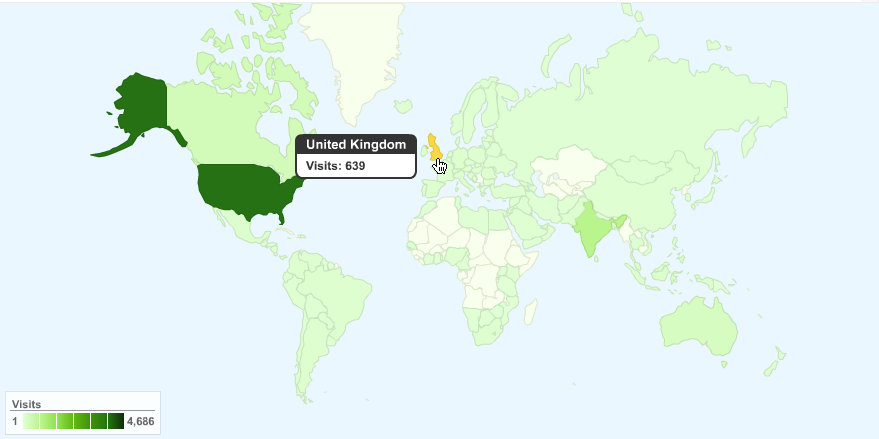
Map Overlay – Found under the Visitors tab, this map of the world will show you where your traffic is coming from. By clicking on any country you can further drill down. In the US you can drill down to the state, and finally by city. Hmmm…Presque Isle, Maine sent me four visitors last month. Maybe I should try and schedule a speaking gig up there.
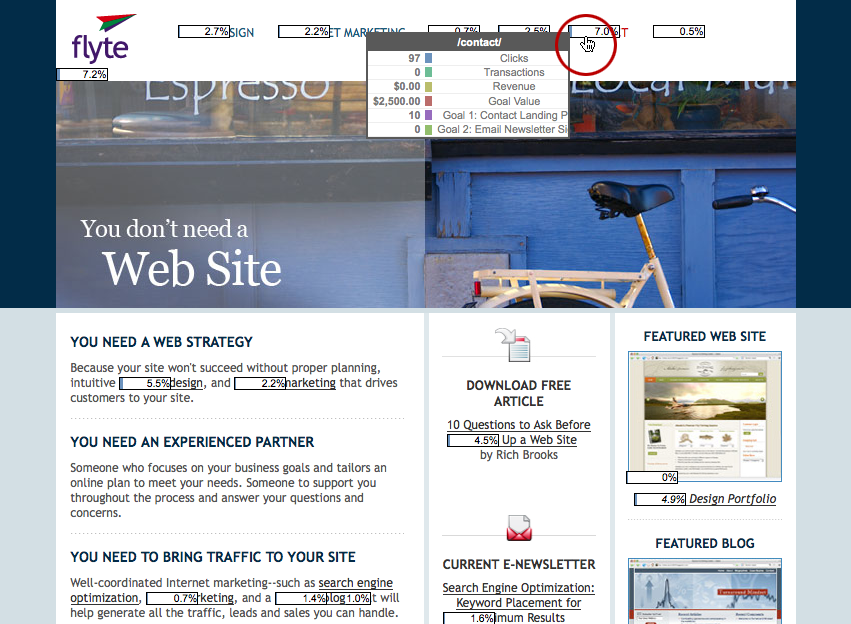
Site Overlay – This tool allows you to see what percentage of visitors clicked on which links on any given page on your site. You might be surprised to discover that no one is clicking on your free download, or that people are jumping right to the contact form from your home page. This can give you insight and help you develop a more effective home page, or any other page on your site.
By clicking on any of the percentage bars you can get additional information if you’ve set up Google Analytic goals. For more on that, read the article Tracking Conversions: Does Your Website Turn Suspects into Prospects?
In Conclusion
There’s a lot more going on in Google Analytics than we’ve touched upon here in this beginner’s guide. Setting up goals, tracking links to external sites, tracking downloads, and even tracking the usage of an internal site search are just a few of the tricks Google Analytics can perform for you.
If you need help installing Google Analytics, or need help understanding and making the most of your own reports, contact flyte today.
–Rich Brooks
President, flyte new media